BACKGROUND: We are starting to learn how to use computer APPS to complete school work at the high school level. Complete the three diagrams below.
LEARNING TOOLS- diagrams.net DIAGRAMS: Review the following to help you understand how to use the basics of draw.io DIAGRAMS:
- Please use your browser to navigate to DIAGRAMS.NET.
- Click START in the upper right corner of the screen.
- Click GOOGLE DRIVE as a destination for your saved files.
- When you are asked to AUTHORIZE, enter the information for your SCHOOL GOOGLE DRIVE. Click all of the appropriate buttons to allow access to your school Google Drive.
- Click CONTINUE, when asked.
- Click CREATE A NEW DIAGRAM.
- Click BLANK DIAGRAM>CREATE.
- ***VERY IMPORTANT STEP: Select NO, PICK FOLDER
- Navigate in your Google Drive to your COMPTECH FOLDER and click on it once to highlight it, then CLICK SELECT
- Your NEW DIAGRAM will open.
- Please review this 1:45 minute video- DIAGRAMS.net HELP LINK to get basic information on how to use DIAGRAMS.NET.
- In general, this program is pretty easy to use: Simply click and drag shapes from the left to the form. Double click a shape to add words. Use the tabs on the right to add color, line style, etc.
- Please note that if your ARROWS in your diagrams look like the image to below, you have not watched the video tutorial and you will not receive ANY points for this project.

- Start making your diagrams (see your project below!)
- See the SAVE YOUR DIAGRAMS STEPS below to SAVE YOUR WORK TO YOUR FOLDER FOR GRADING!
|
HOW TO SAVE YOUR DIAGRAMS TO YOUR COMPTECH FOLDER- Follow these instructions:
- STEP ONE: Finish your diagram!

- STEP TWO: Click FILE>EXPORT AS> JPEG

- STEP THREE: Click to export

- STEP FOUR: Pull down the WHERE drop down box and select PICK A FOLDER!

- STEP FIVE: Find your COMPTECH folder on your school Google Drive and SAVE:

THE DIAGRAMS.NET DIAGRAMS Assignment: FOUR PARTS: Make sure that you save your diagrams properly, as outlined above. If your diagram is not properly saved in your COMPTECH folder, you will receive a ZERO. 50 point assignment.
- "MY FAVORITE THINGS" Chart in DIAGRAMS.NET: To make your "Word Web" into a usable piece of information, we will be recreating your chart using draw.io DIAGRAMS. LEARNING TOOLS were outlined above in the video link. PLEASE MAKE YOUR DIAGRAM SYMMETRICAL. EXTRA POINTS FOR ADDING COLOR, CHANGING FONTS, OR OTHERWISE MAKING YOUR DIAGRAM SHINY AND FANCY.
- "MY 2025-2026 SCHEDULE": Please use your new diagramming skills to create a diagram that VISUALLY DEMONSTRATES all of the courses that you have at Highland High School this year. Make sure to include information about your classes on MONDAY, Block days on TUESDAY/THURSDAY and Block days on WEDNESDAY/THURSDAY, plus your classes last semester. Please include class names and instructors!
- THE CANDY TIER LIST: Tierlists are big nowadays, rating games, products, etc. For this part of the DIAGRAMS PROJECT, you will be creating your own TIERLIST to classify a set of different CANDIES. Here are some specific instructions: (Please NOTE that there is a TRAP in this question- you may encounter it when you set up your table. DON'T FREAK OUT, YOU CAN SOLVE THIS PROBLEM!)
- The Candy: Here is your list of potential candy that you will be ranking on your tierlist. YOU MUST INCLUDE AT LEAST 12 DIFFERENT CANDIES ON YOUR TIERLIST:
- CANDY BARS- (Pick SIX of the following): Snickers, Reese's Peanut Butter Cups, Kit Kat, Twix, Payday, Butterfinger, Milky Way, 3 Musketeers, Almond Joy, Heath Bar.
- REGULAR CANDY- (Pick SIX of the following): Skittles, Starburst, Swedish Fish, Haribo Gummy Bears, Jolly Ranchers, Candy Corn, Sour Patch Kids, Tootsie Rolls, Nerds, M&M's, Twizzlers, Airheads.
- The Table:
- Step 1: In the search bar on the left, type "Table".
- Step 2: Pick the simple Horizontal Table (usually looks like 3 rows).
- Step 3: Use the Arrange Panel on the right to add more rows until you have five (S, A, B, C, Trash).
- Step 4: Arrange your table to have two columns (see Mr. B.'s example below)
- The "Label" Column:
- Click the first cell of each row and type TIER letters, with your explanations.
- The Style:
- Use the Style tab to change the "Fill Color" of your column cells ("S", "C", etc.), please use the "Classic Tier List" rainbow look (Red, Orange, Yellow, Green, Blue).
- The Candy Images:
- The Search: Use Google Images to find "Candy Name" (example: search for "REESE'S PEANUT BUTTER CUPS.")
- The Import: Just Drag and Drop the image directly onto the grid.
- The Resize: This is an important part, RESIZE your image to fit into your table. You might need to use your ARROW KEYS to nudge your images into their proper locations!
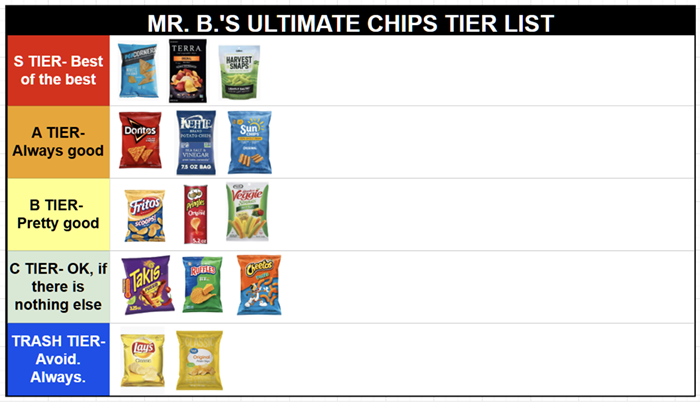
- MR. B.'s SAMPLE TIER LIST OF CHIPS (Yours should look similar):
- "MY FAVORITE THING IN 2026"- From your chart created above, select ONE of the COMPANIES OR BRAND NAMES on the outside of your diagram to be your FAVORITE THING. Then, do some research regarding that favorite thing. You can illustrate all of the following information in a diagrams.net diagram in the same way your did your FAVORITE THINGS CHART above, or you can be creative. The only rule is that your information should be easily accessible and understood!:
- The name of your FAVORITE THING COMPANY/BRAND NAME
- A copy of the LOGO of your company.
- The physical address and telephone number of your company national headquarters.
- A labelled photo of the company headquarters.
- The website address of your company.
- The CEO or President of your company.
- The TOTAL SALES of your company in the year 2024 (2025 won't be available yet, DO RESEARCH.)
- The YEAR that your company was founded.
|
|